File:OVIX-Lead-Time-WFM.png
From WFM Labs
Size of this preview: 788 × 600 pixels. Other resolution: 1,380 × 1,050 pixels.
Original file (1,380 × 1,050 pixels, file size: 166 KB, MIME type: image/png)
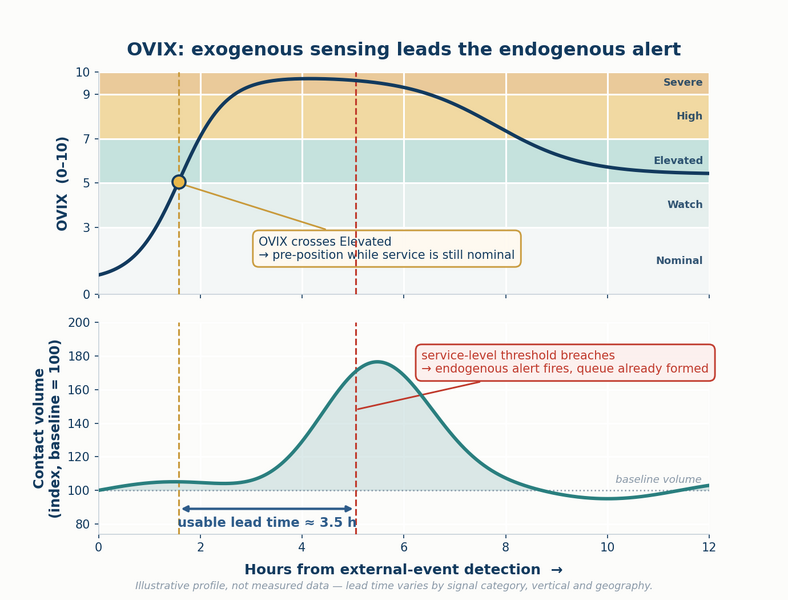
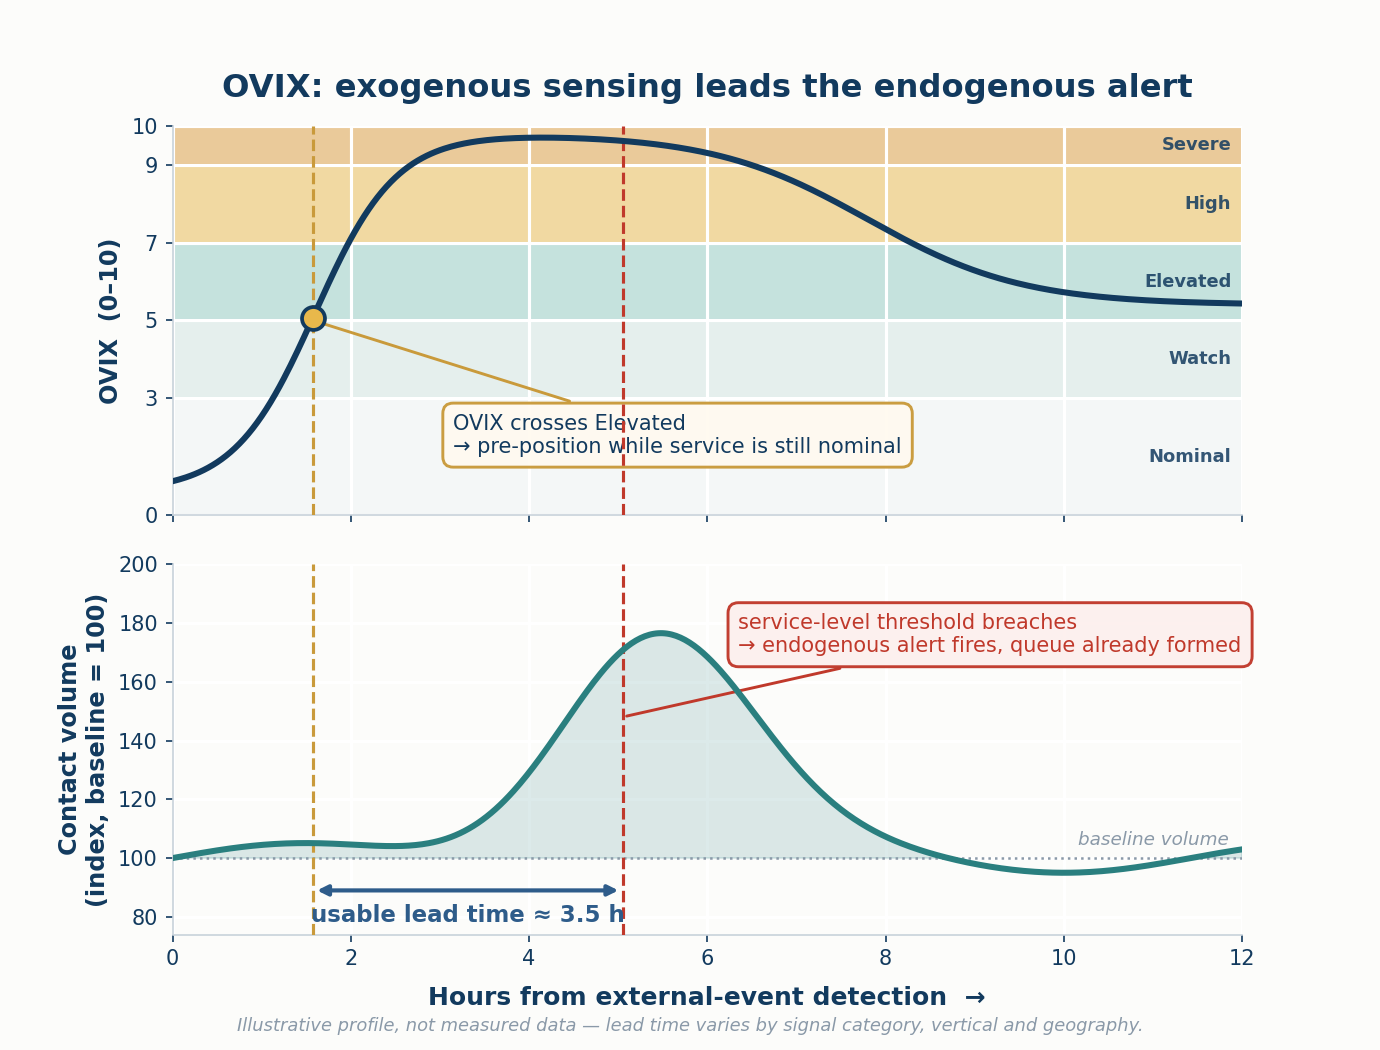
Illustrative profile showing an exogenous volatility index (OVIX) crossing its Elevated band roughly 3.5 hours before contact volume breaches the service-level threshold that would fire an endogenous alert. Supports Operational Volatility Index (OVIX). Generated deterministically with matplotlib (02-working/make-diagrams-2026-07-24.py). Illustrative, not measured.
File history
Click on a date/time to view the file as it appeared at that time.
| Date/Time | Thumbnail | Dimensions | User | Comment | |
|---|---|---|---|---|---|
| current | 20:23, 24 July 2026 | | 1,380 × 1,050 (166 KB) | Tlango (talk | contribs) | Illustrative profile showing an exogenous volatility index (OVIX) crossing its Elevated band roughly 3.5 hours before contact volume breaches the service-level threshold that would fire an endogenous alert. Supports Operational Volatility Index (OVIX). Generated deterministically with matplotlib (02-working/make-diagrams-2026-07-24.py). Illustrative, not measured. |
You cannot overwrite this file.
File usage
The following page uses this file: