File:Business-travel-seasonality-curve.png
From WFM Labs
Size of this preview: 800 × 542 pixels. Other resolution: 2,080 × 1,408 pixels.
Original file (2,080 × 1,408 pixels, file size: 343 KB, MIME type: image/png)
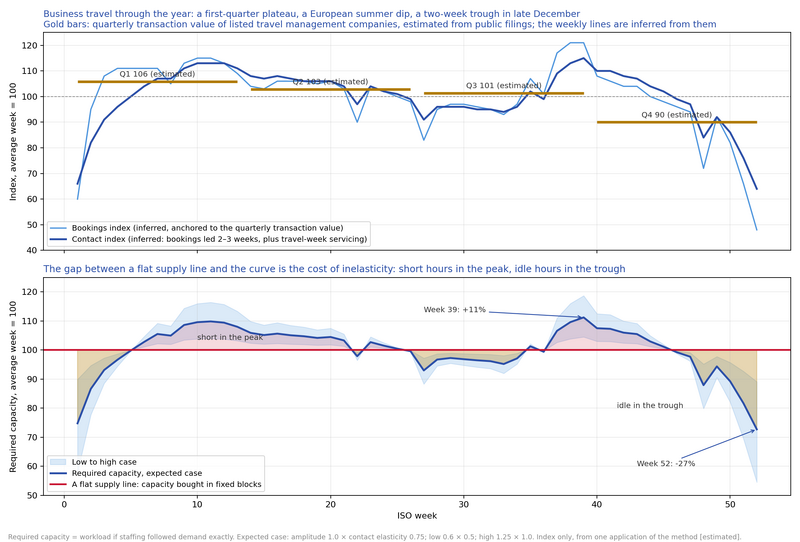
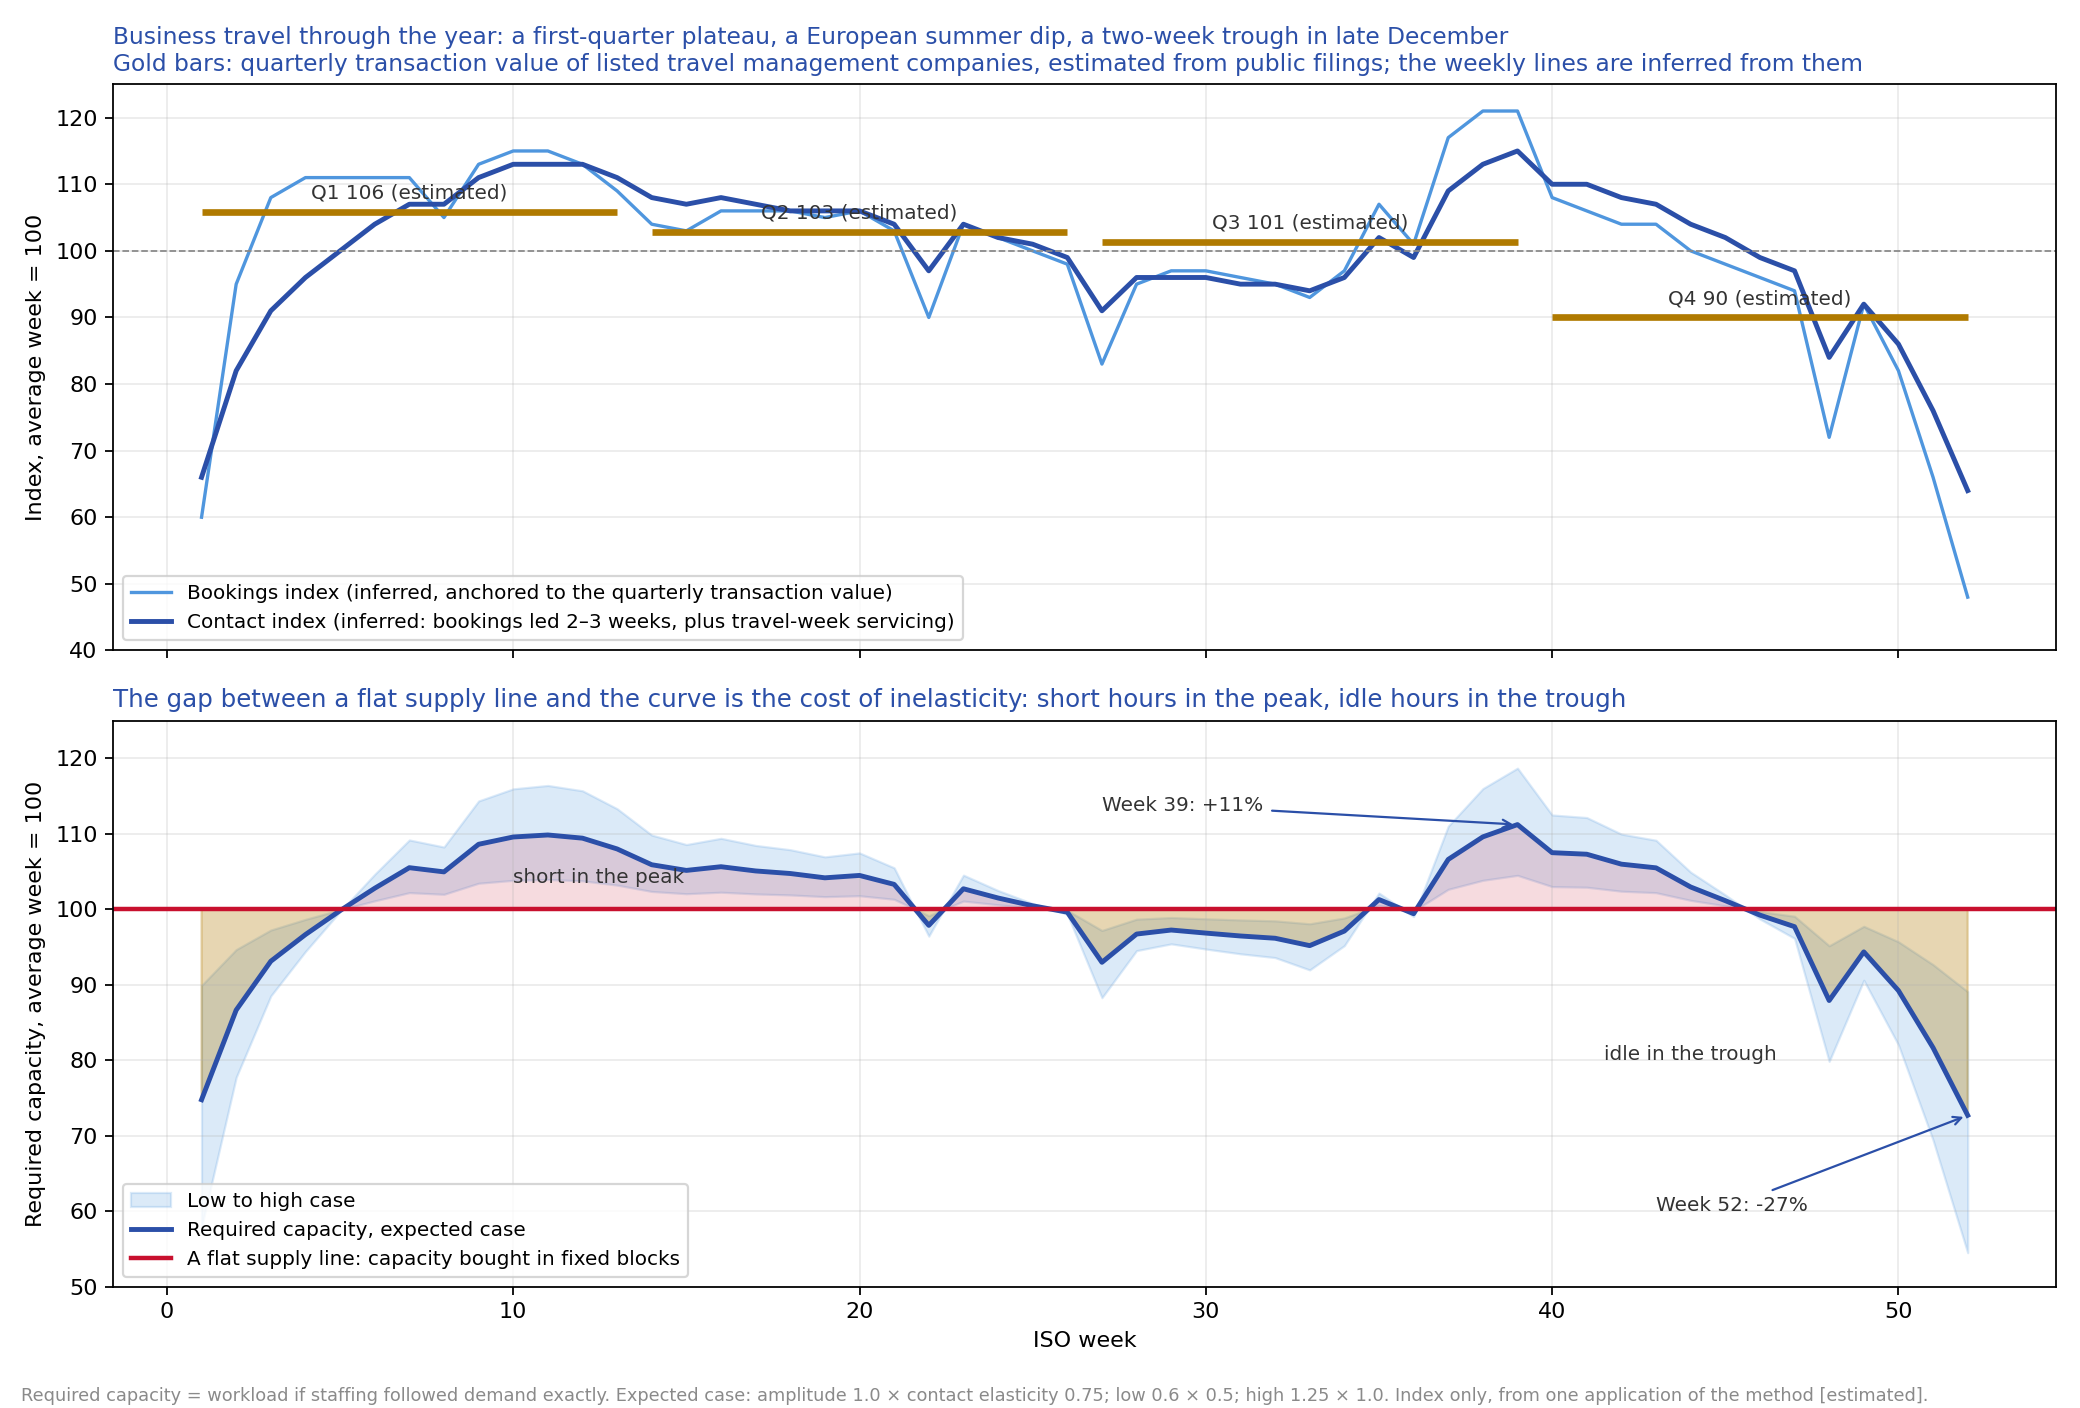
Business travel through the year as an index (average week = 100): bookings and contact indices inferred from the quarterly transaction value of listed travel management companies, and the required-capacity curve against a flat supply line. Index only, from one application of the method [estimated]. Used on Business Travel Demand Seasonality.
File history
Click on a date/time to view the file as it appeared at that time.
| Date/Time | Thumbnail | Dimensions | User | Comment | |
|---|---|---|---|---|---|
| current | 12:34, 3 November 2026 | | 2,080 × 1,408 (343 KB) | Tlango (talk | contribs) | TARS: seasonality figure for the CP-WFM-026 series (index only, no headcount base) [skill:WFMWiki] |
You cannot overwrite this file.
File usage
The following page uses this file: